Achieving the District’s Groundwater Conservation Management Goals
Groundwater Conservation Districts in Texas are required to establish goals in a comprehensive 50-year management plan and adopt rules to ensure those goals are met. An important part of the management plan is the adoption of Desired Future Conditions (DFCs) for the district’s groundwater resources.
DFCs are the desired, quantified conditions of groundwater resources (such as water levels, water quality, spring flows, or volumes) at a specified time in the future. A DFC is a management goal that captures the philosophy and policies addressing how an aquifer will be managed.
On December 15, 2008, the North Plains Groundwater Conservation District recommended that the Joint Planning Committee of Groundwater Management Area 1 adopt DFCs for the Ogallala aquifer in the counties that comprise the district. The Joint Planning Committee considered two DFCs, one for the eastern counties and one for the western counties. Two DFC’s were proposed because they reflected the stakeholder’s desires, and because the uses or conditions of the aquifer within the district differ substantially from one geographic area to another. The DFCs were adopted in 2009 and continue to be a vital tool in managing groundwater in the northern Panhandle.
Using the District’s adopted DFCs, the Texas Water Development Board runs a Groundwater Availability Model (GAM) to determine how much water may be pumped each year and still achieve the DFCs. The amount of water the model predicts to be available, while still meeting the DFCs, is called the modeled available groundwater (MAG).
Comparing the results of the model run with the reported production, the district is in line to achieve it’s 50-year DFC’s goal of having 50% of the groundwater resource available in the eastern four counties and 40% of the groundwater resource available in the western four counties.
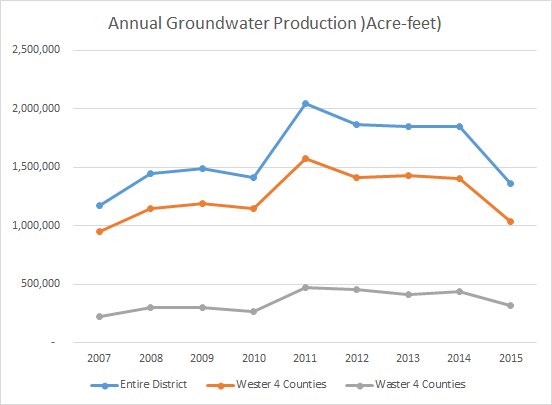
The figures below illustrate that the district has pumped below the MAG since 2010, producing 21% below the MAG from 2010-2015. While the western counties have produced 2 percent more than the MAG during the period, the eastern counties have produced 56 percent less than the MAG.
The following tables show groundwater production compared to the MAG from the Ogallala, Rita Blanca and Dockum aquifers.
District Production Average |
||||
|
County |
Average Annual Production 2010-2015 |
Estimated MAG Average 2010-2015 |
Annual Average MAG Above or Below Production |
MAG Percent Above or Below Production |
|
Dallam |
356,522 |
395,608 |
39,086 |
10% |
|
Hansford |
190,993 |
279,009 |
88,016 |
32% |
|
Hartley |
435,606 |
414,284 |
-21,322 |
-5% |
|
Hutchinson |
64,890 |
60,575 |
-4,315 |
-7% |
|
Lipscomb |
45,349 |
288,831 |
243,482 |
84% |
|
Moore |
213,252 |
196,684 |
-16,568 |
-8% |
|
Ochiltree |
94,629 |
263,716 |
169,087 |
64% |
|
Sherman |
329,426 |
317,830 |
-11,595 |
-4% |
|
Total |
1,730,666 |
2,202,951 |
472,284 |
21% |
|
County |
2015 Production |
2015 Estimated MAG |
2015 Above or Below Production |
MAG Percent Above or Below Production |
|
Dallam |
296,975 |
378,541 |
81,566 |
22% |
|
Hansford |
148,730 |
273,430 |
124,700 |
46% |
|
Hartley |
332,693 |
396,622 |
63,929 |
16% |
|
Hutchinson |
57,632 |
59,845 |
2,212 |
4% |
|
Lipscomb |
39,383 |
287,152 |
247,769 |
86% |
|
Moore |
156,600 |
189,578 |
32,977 |
17% |
|
Ochiltree |
77,342 |
257,969 |
180,627 |
70% |
|
Sherman |
251,647 |
311,796 |
60,149 |
19% |
|
Total |
1,361,002 |
2,154,930 |
793,928 |
37% |
|
County |
Average Annual Production 2010-2015 |
Estimated MAG Average 2010-2015 |
MAG Above or Below Production |
MAG Percent Above or Below Production |
|
Dallam |
356,522 |
395,608 |
39,086 |
10% |
|
Hartley |
435,606 |
414,284 |
-21,322 |
-5% |
|
Moore |
213,252 |
196,684 |
-16,568 |
-8% |
|
Sherman |
329,426 |
317,830 |
-11,595 |
-4% |
|
Total |
1,334,805 |
1,310,820 |
-23,986 |
-2% |
2015 West Production Comparison |
|||
|
County |
2015 Production |
2015 Estimated MAG |
2015 MAG Above/below Production |
|
Dallam |
296,975 |
378,541 |
81,566 |
|
Hartley |
332,693 |
396,622 |
63,929 |
|
Moore |
156,600 |
189,578 |
32,977 |
|
Sherman |
251,647 |
311,796 |
60,149 |
|
Total |
1,037,915 |
1,276,535 |
238,620 |
East – Production Average |
||||
|
County |
Average Annual Production 2010-2015 |
Estimated MAG Average 2010-2015 |
MAG Above or Below Production |
MAG Percent Above or Below Production |
|
Hansford |
190,993 |
279,009 |
88,016 |
32% |
|
Hutchinson |
64,890 |
60,575 |
-4,315 |
-7% |
|
Lipscomb |
45,349 |
288,831 |
243,482 |
84% |
|
Ochiltree |
94,629 |
263,716 |
169,087 |
64% |
|
Total |
395,861 |
892,131 |
496,270 |
56% |
2015 East Production Comparison |
||||
|
County |
2015 Production |
2015 Estimated MAG |
2015 MAG Above/below Production |
MAG Percent Above or Below Production |
|
Hansford |
148,730 |
273,430 |
124,700 |
46% |
|
Hutchinson |
57,632 |
59,845 |
2,212 |
4% |
|
Lipscomb |
39,383 |
287,152 |
247,769 |
86% |
|
Ochiltree |
77,342 |
257,969 |
180,627 |
70% |
|
Total |
323,087 |
878,395 |
555,308 |
63% |