WCC Demonstration Update
By David Sloane, Ph. D
Fall Precipitation
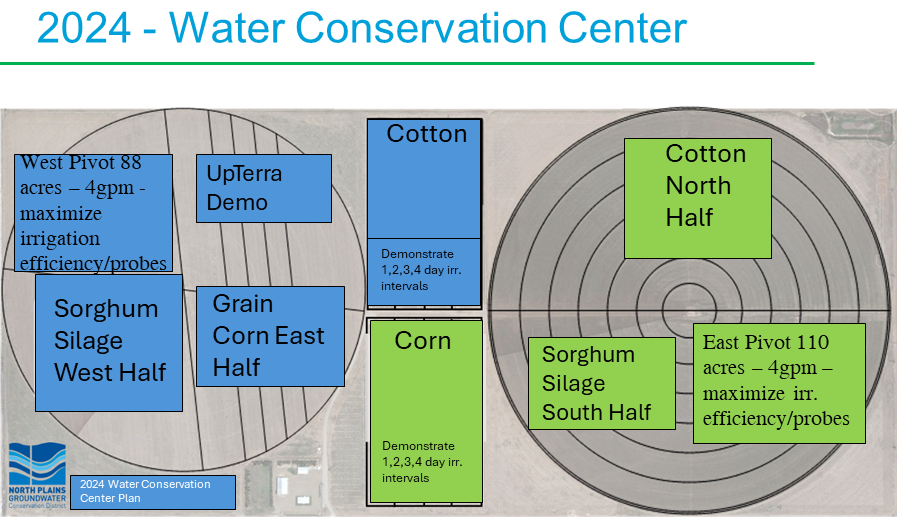
As you would all be aware, the district has been blessed with some significant rain recently. The Water Conservation Center (WCC) has had approximately 4.5 inches of rain in the last month, and it is interesting to watch the soil wet-up after the previous crops. The east pivot had a cotton / forage sorghum split and the west pivot had a corn / forage sorghum split. The crops grown over the 2024 season left the fields with varying degrees of soil moisture and it is interesting to observe the effect of the rain in the last month. The cotton dried the soil out the most, which was not surprising given the long warm fall and the continued water use. The cotton depleted the soil by about 10” of stored soil moisture and after the recent rain, there is still over 5” needed to fill the profile. The separate layer graph (not shown) shows that the soil is still wetting up in the top 2 feet from the surface.
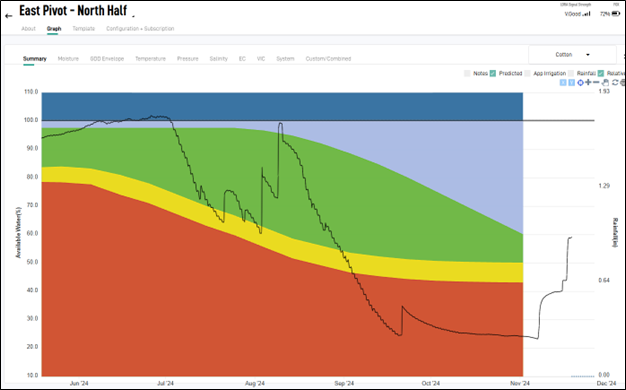
Figure 1. Cotton soil moisture graph showing almost 10” of moisture depletion and still a 5.5” deficit to fill the profile.
The forage sorghum grown on the south half of the east pivot depleted the soil profile of 5” of stored soil moisture by the time it was cut for silage. The recent rains have half-filled the profile and there is still 2.5” needed before planting next spring. It is interesting to note that a 1.5” rainfall on September 19 was not evident in the graph (Figure 2). The separate layer graph (not shown) shows that the soil is wetting at the 40” layer, indicating that the rain has done a great job of wetting the top 3 feet of soil.
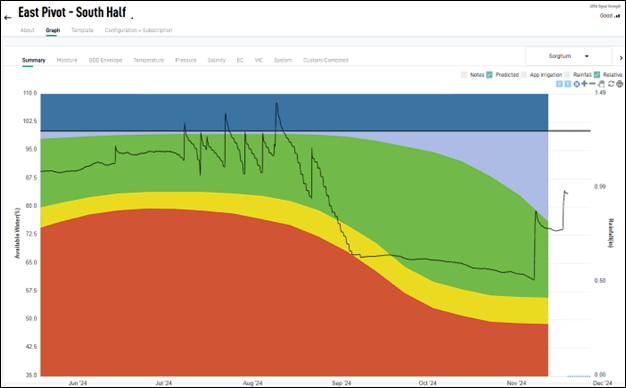
Figure 2. Summary water use graph of forage sorghum grown on the south half of the east pivot. The soil was depleted of approximately 5” of moisture at harvest.
The forage sorghum grown on the west pivot shows a very similar trend to the east pivot, where the crop used about 5” of stored soil moisture. The recent rains have refilled about half of the soil profile, however what is really interesting is that the 1.5” rainfall on September 19 does show up on the west pivot. Furthermore, the sorghum that was cut for silage, undergoes a substantial amount of regrowth after the rain. This can be seen as water use (or stair-stepping) on the graph. While outwardly this water usage might seem bad, the field was planted to a wheat cover crop and so any regrowth (to cover the ground) was highly desirable. Observations show that the regrowth was fairly even on both fields and so the differences in the graph are probably due to the proximity of plants growing near the probes.
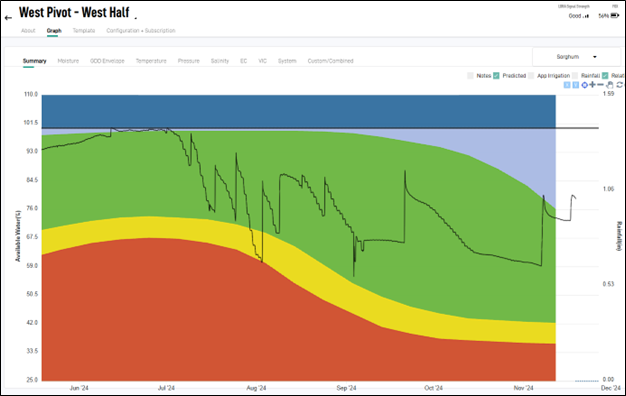
Figure 3. Summary water use graph of forage sorghum grown on the west half of the west pivot. The graph shows that the soil was depleted of 5.5” of soil moisture by harvest and that the recent rains have wet the soil substantially, so that the current deficit is only about 3.5”.
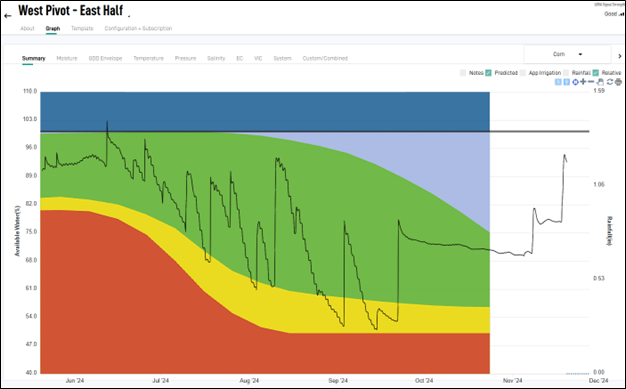
The corn grown on the east half of the west pivot (Figure 4) shows that the crop depleted the soil of over 6” of stored soil moisture. This was slightly higher than was observed in previous seasons but was probably due to the long, hot finish to the season. The 1.5” rain that came after harvest did a great job of wetting up the soil profile. This was similar to the other side of the same circle, but unlike the sorghum half, there was no subsequent water use, and all of the rainfall was retained. The more recent rain has almost fully refilled the soil profile, and this field is looking good for next season.
As you can see, the different crops took different amounts of stored soil moisture, with cotton really drying out the profile this year. Even though there has been great rainfall recently (around 4.5”), the cotton field is still running a 5” deficit. While cotton doesn’t require a lot of in-season irrigation compared to other crops, care must be taken to make sure you refill the soil profile before the next crop. Soil moisture probes kept in after the season has ended are a great way of knowing where you finished the last crop and ensuring you start the next crop in a position to be successful.

