WCC Demonstration Update – October 2024
By David Sloane, Ph. D
Sharing Water by Split Planting
Forage Sorghum Yields
The forage sorghum was windrowed September 5 and picked-up on September 9 for both the east and west pivots. The total average yield was 17.4 tons/ac across both the east and west pivots, but this still needs to be corrected to a 65% moisture value since the moisture at the time it was picked up would have been significantly less. The final numbers on yields for each field have yet to be determined, so we are unable to make comparative yield observations between the two treatments (corn / sorghum vs cotton / sorghum split planting). Stay tuned.

Fig 1. Windrowing and harvest of the forage sorghum
Corn Yield (west pivot)
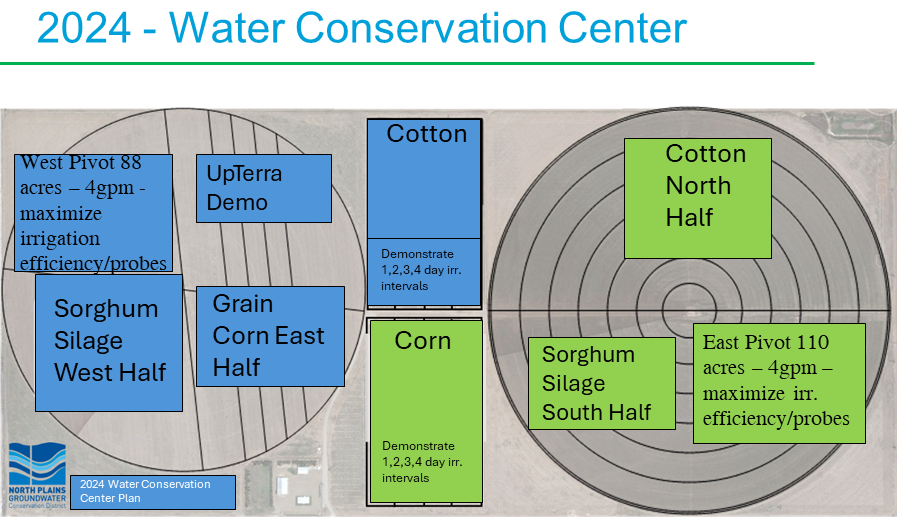
The west pivot was split planted with corn on the east half and forage sorghum on the west half. The corn (P1366AM) was planted on May 14 @ 30K population and harvested on September 30. There were 10,428 bushels harvested on the east half of the west pivot (43.5 ac) at an average moisture content of 14.78%. The corrected average grain yield for the west pivot corn was 243.2 bu/ac, with an average test weight of 59.5. This is an improvement compared to results in previous years for this field.
Figure 2 shows that there was some variation in corn yield between the north and south of the west pivot, with higher yields observed in the northern part of the field. Both the GroGuru and the AquaSpy probes were installed at the northern end of the field. This part of the field appears to have benefitted the most from irrigation scheduling according to the probe data. The south end of the field was noticeably drier than the north end.

Fig 2. Fieldview yield map for the corn grown on the west pivot
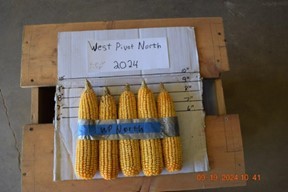
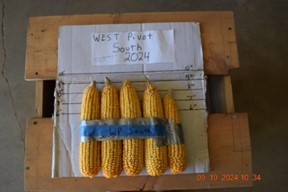
Figure 3 shows the ear size of random ears picked from the north end of the field compared to the south end of the field. The south end showed more variability in ear size, which corresponds to the lower yields observed in the yield map (Fig 2).


Fig 3. Ear size from random ears picked from the north (top) and south (bottom) ends of the field.
Cotton Yield (east pivot)
The cotton field on the north side of the east pivot has not yet been harvested. However, it achieved a good plant stand and it has progressed well and enjoyed a long (warm) tail to the season. As such, it is expected to yield well and achieve a good water use efficiency score.
Comparison of sprinkler vs drip irrigation
The south SDI fields were planted to corn on the same day as the west pivot, with the same hybrid and at the same density. The SDI plots produced an average yield of 186.21bu/ac with an average test weight of 60.2 across the whole 19 acres, which was a significantly lower field average yield than the pivot irrigated field. Early season technical issues, delayed implementation of the desired irrigation regimes and verification of total irrigation volumes still need to be reconciled. The irrigation plan was implemented in the second half of the season and the yield map does seem to correlate with the different irrigation regimes (i.e. irrigation every day, every 2nd, 3rd or 4th day, while using the same total volume of water). Figure 4 shows that irrigating every day with the SDI yielded much better than irrigating every 4th day with a 4x greater run time. It is also clear from Figure 4 that some parts of the SDI field yielded as well or better, on significantly less water, than for the pivot irrigated field. More detail will be presented as the data are analyzed.

Fig 4. Yield map for the south SDI corn plots.
As previously mentioned, neither the cotton on the sprinkler irrigation or SDI fields have not been harvested. It appears that the plant stand on the SDI field was lower than under the pivot and this was attributed to a lower germination rate. It is always harder to get the surface wet enough to germinate cotton seed under subsurface drip irrigation. There are also many different varieties planted in the SDI plots and based on observations, the expectation would be that the pivot irrigated cotton will yield higher than the SDI. Yields will be reported after the crop has been harvested and ginned.
Different irrigation regimes in the SDI plots
As indicated above, more detailed assessment is required to separate out the average plot yields from the yield map. It appears (Fig 4) that irrigating every day yielded significantly higher yields than the other treatments, however the irrigation regime was late being implemented and further analysis will be needed to separate the total irrigation volume applied to each treatment. This will be reported in future updates.

